Information graphic

We use information graphics to illustrate Lantmännen’s business operations. Information graphics are visually appealing and make it easier for the recipient to absorb the content.

This enables us to present facts, which often consist of both words and images, in a way that means the finished result says more than words or an image could do separately. 


Diagrams and tables

Graphs and tables are examples of simple information graphics. Advanced graphics often consist of several illustrations integrated with text to illustrate processes or developments.

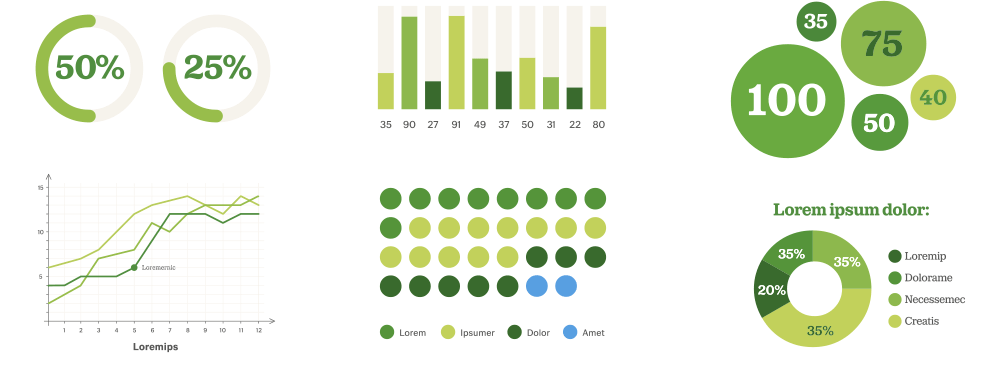
Examples of Lantmännen styles for tables and graphs are shown here.

Colors for information graphics

The colour scheme is primarily green with the green colours from the colour palette for information graphics. Use the sand coloured background colour as a neutral complementary colour. The blue kick colour can be used to make the information stand out more.

Three additional colour schemes in orange, blue and brown, are available as a complement to the green colour scale. These are used to clearly differentiate information or values with the use of colour, when the green scale does not do this sufficiently.

Illustrated chain from field to fork

A useful graphical object is the illustrated chain from field to fork. It builds on our style of pictogram and can therefore be changed and built on, as required.

The pictograms and illustrations are being continuously developed. If you don't have the symbols or you have an idea of a new symbol, get in touch with us at identity@lantmannen.com 

Examples

Here are a couple of examples of how information graphics can work: In the example above, the graph and pictogram have been combined with some relatively simple statistics to form an exciting and varied facts page.

An example of more advanced infographics is shown below, that in a visually appealing way, explains Lantmännen’s profit allocation model very simply. The illustration profile should be based on the profile developed for our pictogram.

Examples

Here we show graphs and models developed for working with layouts in print and digital channels.